• Resolved ulim

    (@ulim)


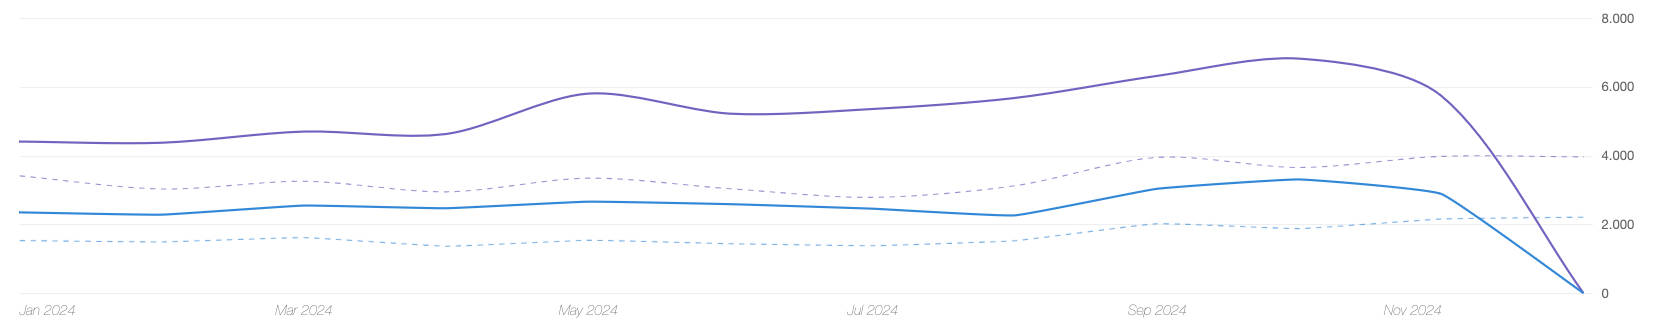
    With the last update or the one before the “Daily Traffic Trend” report changed, so that it won’t display daily data anymore. Rather, it will aggregate data for weekly or monthly periods, depending on the time range of the graph.

    This was an important feature to me that I could e. g. check which day had the most traffic this year by looking at the curve and then mousing over the highest point. Right now everything is averaged out and smoothed to the point of being useless. Especially since the curves trail off at the edges of the diagram, which in no way represents the real data.

    Can I remove the “smoothing” and display the real data again?

    Kind regards,

    Ulrich

Viewing 11 replies - 1 through 11 (of 11 total)
  • Plugin Support Matthew

    (@mhdizmni)

    Hi @ulim,

    Thank you for opening the thread!

    Kindly note that when the date range is set to “This Year”, graphs display monthly statistics, allowing you to track visit patterns across different months. This makes it easy to identify peak and low-traffic months. Please refer to this image as a reference: https://i.vgy.me/P3DNfq.png.

    For day-by-day statistics, select a specific month (date range) to view the data within that timeframe.

    Thank you!

    Regards,
    Matthew

    Thread Starter ulim

    (@ulim)

    Hello,

    Thank you for verifying the problematic behavior that I am encountering myself. It seems that I did not explain the problem clearly enough, so let me try again:

    I would like to find the days with the most, second most and third most traffic in the last year. Previously I could display the data for one year and hover over the highest points in the graph and that day’s data was displayed.

    This feature was removed.

    The data is now averaged over a period of time, whereas previously it was displayed “as is”. If I want to get daily data, I have to display every single month of a year, which is obviously completely tedious to do 12 times in a row. And what if I enter a custom range over 2 years? I need to go through 24 months one by one and write down the three highest days and then consult my piece of paper to find among the 24×3 days I noted the three highest ones manually. I mean, that can’t seriously be asked of the user of a digital product.

    The yearly graph is now useless to me. It does not display anything of interest – basically it is just a smoothed out, straight line that trails off towards the end, because we don’t have the December data yet. But this display also skews the November data (and probably January as well), which I find completely nuts:

    So, is it possible to get the old graphs back? Maybe as a paid feature?

    Plugin Contributor Navid Kashani

    (@kashani)

    Hi @ulim ,

    I truly appreciate your thorough explanation and the specific use case you’ve described.

    I understand how important this feature is to you, and I’ll review this today to assess the situation and explore potential solutions. I’ll get back to you with an update shortly.

    Thank you for your patience and for helping us improve WP Statistics.

    Best regards,
    Navid
    Product Manager, WP Statistics

    Plugin Contributor Navid Kashani

    (@kashani)

    Hi @ulim,

    We discussed your concerns during our meeting today, and we’ve decided to add the ability to manually change the chart interval. This will allow you to view daily, weekly, or monthly data as per your preference, giving you back the flexibility you need.

    This new feature will be included in our next major version (14.12), which we plan to release before the end of 2024. We hope this update will address your needs and improve your experience with WP Statistics.

    If you have any additional suggestions or feedback in the meantime, feel free to share them.

    Best regards,
    Navid
    Product Manager, WP Statistics

    Thread Starter ulim

    (@ulim)

    Ok, thank you very much for making this effort and I will report back once the new version is out.

    Kind regards,

    Ulrich

    Thread Starter ulim

    (@ulim)

    Well, I have upgraded to 14.12.1 but it looks exactly like the previous versions. Have you implemented anything or has this been postponed to a later version?

    Kind regards,

    Ulrich

    Plugin Support Matthew

    (@mhdizmni)

    Dear @ulim,

    We are pleased to inform you that this feature will be included in version 14.12.2, which is scheduled for release in the next few days.

    We sincerely appreciate your patience and apologize for any inconvenience caused by the delay.

    Regards,
    Matthew

    Plugin Support Matthew

    (@mhdizmni)

    Dear @ulim,

    I’m delighted to share that we’ve introduced a time interval selector for the charts in version 14.12.2.

    You can now select the intervals to be Daily, Weekly, or Monthly.

    Please update WP Statistics to the latest version and take advantage of this new feature!

    Thank you for your continued support!

    Regards,
    Matthew

    Thread Starter ulim

    (@ulim)

    Dear @mhdizmni

    I’m sorry, I misspoke at first, because I did not understand the changes. I’ll edit this post to remove the previous erroneous content.

    The interval selector works differently for weekly, monthly and daily and I was only looking at weekly and monthly, which still return averages. But the daily selector now gives me access to the real data, which was my main issue. Thank you for fixing that and I think we now have the best of both worlds: we can see averages if we prefer that or the real, uninterpreted data if we prefer that.

    Kind regards,

    Ulrich

    • This reply was modified 2 months, 1 week ago by ulim.
    Plugin Support Matthew

    (@mhdizmni)

    We are glad to be of help!

    Rest assured, we’re continuously working to enhance WP Statistics to better meet the needs of our users.

    Your feedback is invaluable and plays a crucial role in guiding our improvements.

    Thank you for your continued support!

    Regards,
    Matthew

    Thread Starter ulim

    (@ulim)

    Thanks, I posted up a donation.

Viewing 11 replies - 1 through 11 (of 11 total)
  • You must be logged in to reply to this topic.