• Resolved silencerocks

    (@silencerocks)


    Dear IA-Team,

    there are already posts about performance-problems for sites 500k+ Visitors/Month.

    But I run into Problems after just 7 days and 4000 users combined. The predefined reports like “Top Landing Pages” are ok, but if i apply a filter like

    “include” “URL” “contains”

    The page won’t load and uses 100% of the server’s cpu power.

    I can understand that filtering takes resources – but is there a better way to narrow down the results to individual pages? I need to explicitly track 6 sites on my website (and that should show on a 30 day-graph).

    I would also buy the pro-version if that helps.

    Edit: Now, 10 min later it works flawlessly and very fast. Error log shows:

    2024/03/21 00:55:45 [error] 774208#774208: *126630 upstream timed out (110: Connection timed out) while reading response header from upstream, client: 212.56.161.20, server: <my domain>, request: “POST /wp-admin/admin-ajax.php HTTP/2.0”, upstream: “fastcgi://unix:/var/run/wordpress.php-fpm.sock”, host: “<my domain>”, referrer: “<my domain>/wp-admin/admin.php?page=independent-analytics&tab=views&report=19”
    2024/03/21 00:45:14 [error] 774208#774208: *126542 upstream timed out (110: Connection timed out) while reading response header from upstream, client: 188.180.154.62, server: <my domain>, request: “GET /psycho-tests/bin-ich-explosiv/ HTTP/2.0”, upstream: “fastcgi://unix:/var/run/wordpress.php-fpm.sock”, host: “<my domain>”, referrer: “https://www.google.com/&#8221;

    2024/03/21 00:55:45 [error] 774208#774208: *126630 upstream timed out (110: Connection timed out) while reading response header from upstream, client: 212.56.161.20, server: <my domain>, request: “POST /wp-admin/admin-ajax.php HTTP/2.0”, upstream: “fastcgi://unix:/var/run/wordpress.php-fpm.sock”, host: “<my domain>”, referrer: “https://<my domain>/wp-admin/admin.php?page=independent-analytics&tab=views&report=19”
    2024/03/21 00:45:14 [error] 774208#774208: *126542 upstream timed out (110: Connection timed out) while reading response header from upstream, client: 188.180.154.62, server: <my domain>, request: “GET /psycho-tests/bin-ich-explosiv/ HTTP/2.0”, upstream: “fastcgi://unix:/var/run/wordpress.php-fpm.sock”, host: “<my domain>”, referrer: “https://www.google.com/&#8221;

    Thank you ??

    • This topic was modified 8 months, 1 week ago by silencerocks.
Viewing 9 replies - 1 through 9 (of 9 total)
  • Plugin Author Ben Sibley

    (@bensibley)

    Hi there,

    Thanks for getting in touch about this.

    I’m glad to hear this error resolved itself! The error messages are basically letting us know that an HTTP request timed out, but there aren’t any hints about why this occurred in the first place. If you have any more issues in the coming days, please let us know here and we can debug further if necessary.

    Thread Starter silencerocks

    (@silencerocks)

    Hello Ben,

    unfortunately the error persists for approximately 98% of the time.

    • The Stats show perfectly if I use the predefined Sections like “Top Landing Pages”, “Fastest Growing Pages” etc. and also longer date ranges like 30 or 90 days.
    • It also works, when I use an URL-Filter with just a single day.
    • It’s not working anymore as the date range is a week or more.

    The error log shows:

    2024/05/08 12:26:45 [error] 3904297#3904297: *109825 upstream timed out (110: Connection timed out) while reading response header from upstream, client: 212.56.161.32, server: dr-armin-kaser.com, request: “POST /wp-admin/admin-ajax.php HTTP/2.0”, upstream: “fastcgi://unix:/var/run/wordpress.php-fpm.sock”, host: “dr-armin-kaser.com”, referrer: “https://dr-armin-kaser.com/wp-admin/admin.php?page=independent-analytics&#8221;

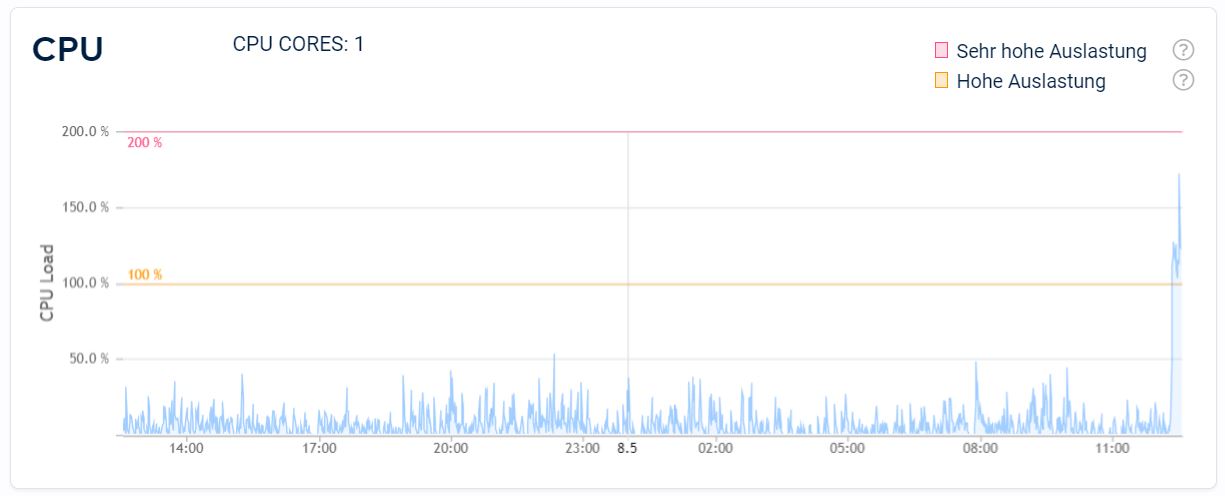
    Just after trying to get the data, server logs show a spike in CPU-Load.

    Since this might be a performance issue/time out-issue i measured the time until the stats show.

    With a URL-Filter applied:

    Date range: 1 day -> Stats showing after: 1s
    Date range: 7 days -> Stats showing after: 15s
    Date range: 30 days -> Stats showing: Never (but would be after 64s, calculated from the obove)

    I’d happily give you access to my site’s backend, no problem.
    The site is dr-armin-kaser.com

    • This reply was modified 6 months, 3 weeks ago by silencerocks.
    Plugin Author Ben Sibley

    (@bensibley)

    Thanks for the detailed notes on this. It sounds like the size of the query is causing the DB to run out of memory, and it then turns to the CPU which runs much slower.

    Could you try running the SQL command below? It’s going to create a new index on the resources table, and we’re curious to see if it has an impact on how fast the URL filter runs.

    CREATE INDEX cached_url_index ON wp_independent_analytics_resources (cached_url);

    This command assumes the table prefix is “wp_” but please replace that if you are using a custom prefix.

    After this is run, it’d be great to get the same benchmarks for the URL filter.

    Thread Starter silencerocks

    (@silencerocks)

    Hi! Thank you for your quick answer. I also upgradeded WP and PHP.

    After PHP Upgrade 7.6->8.2 and WordPress 6.4->6.5.3

    Date range: 1 day -> Stats showing after: 1s
    Date range: 7 days -> Stats showing after: 5s
    Date range: 30 days -> Stats showing: Never

    That didn’t solve the problem.

    So I tried the SQL-Command

    Date range: 1 day -> Stats showing after: 1s
    Date range: 7 days -> Stats showing after: 1s
    Date range: 14 days -> Stats showing: 229s
    Date range: 30 days -> Stats showing: Never

    All the Spikes happend, when I tried to get data from IA. The one on the left was even 2.5 hours long – still just a 30-day-request.

    Strangely in rare cases the 30days graph and data show up. But I could not figure out, why or when that happens. In that case, the graph with data show within a few seconds.

    Since you mentioned that the problem might have to do with memory, could my actual php_memory_limit = 128M be the problem? Or my server resources/hosting plan (1core, 2GB RAM)?

    • This reply was modified 6 months, 3 weeks ago by silencerocks.
    Plugin Author Ben Sibley

    (@bensibley)

    Thank you for the trying that!

    Could you run the following command and let me know the integer that it returns?

    SHOW VARIABLES LIKE '%innodb_buffer_pool_size%';

    Depending on the value you get back, you can try running this command next, which will change the buffer pool size to 1GB (in bytes):

    SET GLOBAL innodb_buffer_pool_size=1048576000;

    My guess is that the current value is less than 1GB, but you can skip this command if it’s actually equal or higher already.

    The big idea is that when the query uses more resources than allocated here, it switches to using the CPU which is thousands of times slower. That’s why instead of 14 days taking 2x as long as 7 days, it passes this threshold and the performance falls off a cliff.

    Thread Starter silencerocks

    (@silencerocks)

    Thank you a lot for your effort.

    SHOW VARIABLES LIKE '%innodb_buffer_pool_size%';

    resulted in:

    innodb_buffer_pool_size: 268435456

    which would be 0,26 GB. I don’t have the privileges to set

    SET GLOBAL innodb_buffer_pool_size=1048576000;

    myself, so I requested it from my hoster. They’re only going to do it on monday, so I wait for that and will tell you about the result.

    In the meantime – have a nice week ??

    Plugin Author Ben Sibley

    (@bensibley)

    Awesome, thanks for the confirmation! I’m looking forward to the results – I think it should get things running much faster.

    Have a great weekend in the meantime ??

    Thread Starter silencerocks

    (@silencerocks)

    Dear Ben,

    I have the results now. Instead of changing the buffer size for the actual database, the support told me to switch to a newer server, that they planned to do soon anyway. After the switch now the URL-filtered results show instantly, regardless of the date range. So:

    Date range: 1 day -> Stats showing after: <1s
    Date range: 7 days -> Stats showing after: <1s
    Date range: 14 days -> Stats showing: 1s
    Date range: 30 days -> Stats showing: 1s
    Date range: 90 days -> Stats showing: 1s

    On the new server I get this value:

    innodb_buffer_pool_size: 1073741824

    (was 268435456 on the old one)

    so I think, your solution was right

    I could not be happier ?? Left you a review. Keep up the great work!

    Plugin Author Ben Sibley

    (@bensibley)

    That’s great news! I’m so glad to hear that increasing the buffer size fixed the performance issue.

    Thanks for the excellent review too ??

Viewing 9 replies - 1 through 9 (of 9 total)
  • The topic ‘Low Performance when applying URL-Filters’ is closed to new replies.